Example:
is a 2-by-3 matrix.
Just as a 2-by-2 matrix defines a transformation of the plane, an -by- matrix defines a transformation . An -by- matrix is a rectangular array of numbers with rows and columns.
is a 2-by-3 matrix.
The transformation associated to an -by- matrix is the map where:
is the vector whose th entry is obtained by multiplying the th row of into the column vector , that is
This vector has height because there are rows of to multiply into the vector .
For example, shows how a 3-by-3 matrix eats a vector of height 3 and outputs a vector of height 3.
Take . We get We see that this is a rotation of 3-dimensional space which fixes the -axis and rotates by in the -plane. We call it a rotation by about the -axis.
Take . We need to feed a vector of height 3; it will output a vector of height 2. In other words, defines a transformation . What is the transformation? This is the projection to the -plane (which squishes the -axis to the origin).
Take . This gives a map : This is the inclusion map of the 2-dimensional -plane into 3-dimensional space (putting it at height zero).
These rectangular (nonsquare) matrices change the dimension of the space we're working with, e.g. map from a lower to a higher dimensional space or vice versa. You might wonder why we matrices which are bigger than 3-by-3, given that we live in a 3-dimensional universe. In fact:
the theory of special relativity treats space and time on an equal footing, and the Lorentz transformations, which describe all the weird relativistic effects like time dilation and length contraction, mix up space and time, and are given by 4-by-4 matrices.
in statistics, data is often represented as a vector of samples; the more samples you have, the bigger the dimension of the vector you need to encode them.
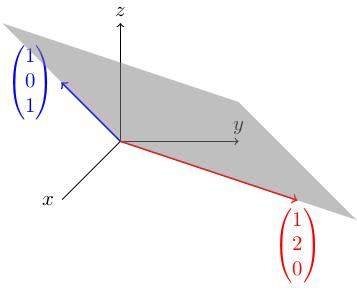
Take . This defines a map : What does this map "look like"? Its image (the set of points in 3d which have the form for some ) is a plane. To visualise the plane, we and draw the images of the - and -axes in :
The -axis (vectors of the form ) goes to the set of vectors .
The -axis (vectors of the form ) goes to the set of vectors .
The image of is the unique plane containing these two lines.
Take . This defines a map : What does this map look like? Let's imagine it's projecting from 3-dimensional space onto the -plane (by including into as the -plane). The points on the -plane go to (i.e. they stay where they are). The point on the -axis goes to . This means that everything is being projected onto the -plane; the projection is along straight line rays which point in the -direction (because to get from to you have to go backwards 1 in each of the , and directions. This map is therefore a projection.
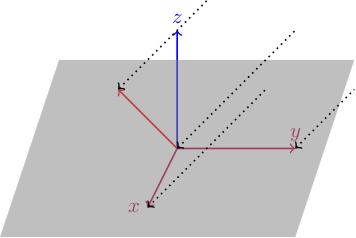
This line along which we're projecting has a name: it's called the kernel of . More on this later.